On a call, Eron’s family decided to make a tier list of fruits. Each person assigned a fruit a rating between F–SSS. We entered values for 41 fruits (well… Allen made a “cRaZy ZoNe” of fruits many of us haven’t eaten (e.g. Rambutan)).
I mapped them to numerical values 1–5 (where S, SS, and SSS where all “5”), and looked at some of the data—interpretation is left to the reader.
Top fruits:
| Blueberry | Lime | Green Grapes | Cherries | Pineapple | Strawberry |
|---|---|---|---|---|---|
| 4.3 | 4.2 | 4.2 | 4.2 | 4.2 | 4.2 |
Central tendencies
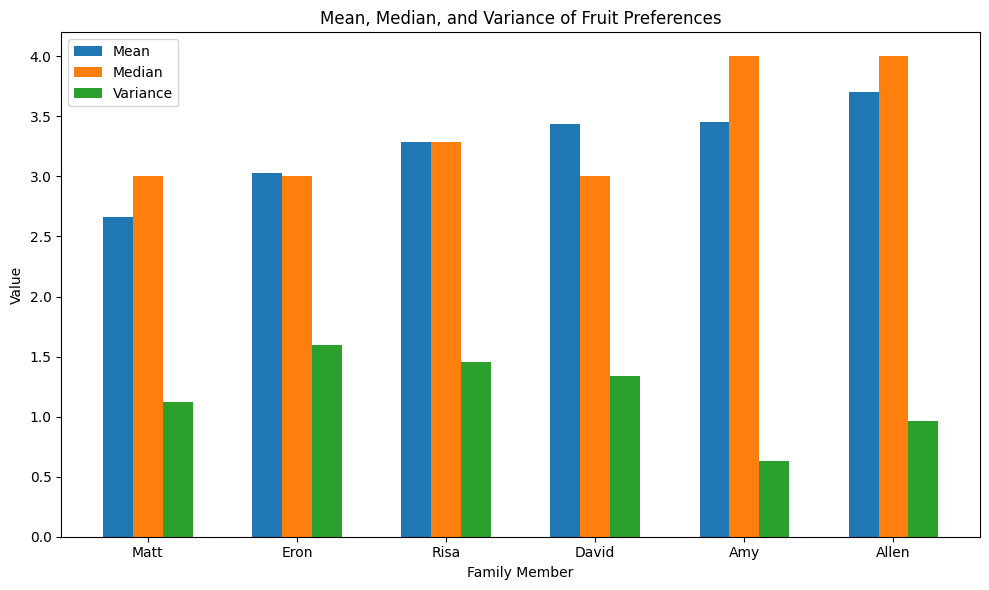
Classic mean/median values. Amy and Allen have the highest median values (they generally like most fruits) and have less variation in their responses.

Preference comparison and plotting
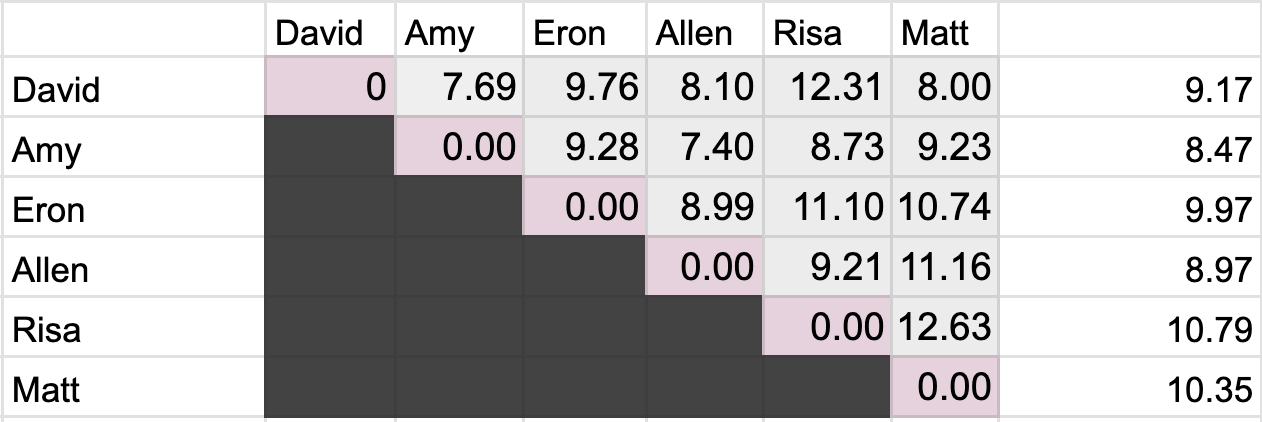
We can also compare directly people’s 41 dimensional vectors. The table below shows the squareroot of the sum of squares between each set of preferences: closer numbers mean the people have more similar food preferences. The last column is the average distance from others. Amy is the closest to everyone, and Risa is the furthest.

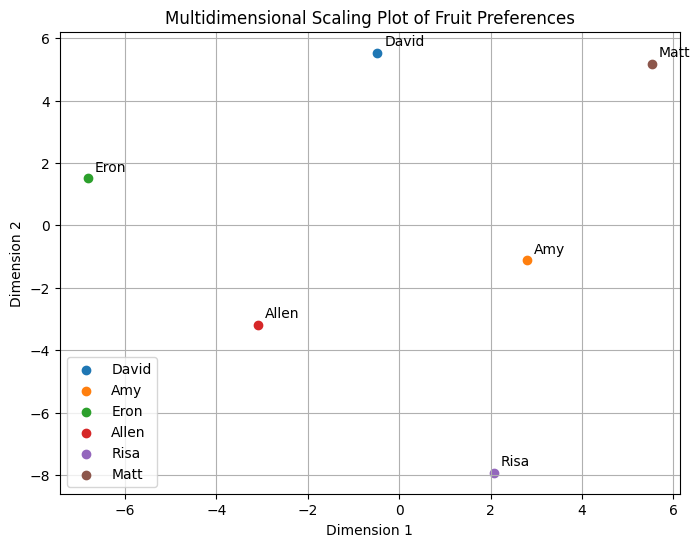
Can we visualize everyone in the same plot? Yes—by using MultidimensionalScaling! (I’m writing this to work through MDS…)
First, we take the symmetrical distance matrix (above) and square all the values in it (). We want to center the entire matrix (in case its offset). To do that we multiply it by the centering matrix C: where is the centering matrix, is the number of people (6), and is the identity matrix, and is an full of 1s We apply double centering to get the matrix :
Okay, now that we have we can extract the eigenvectors/eigenvalues (like what you do for principle components analysis). Eigenvectors are vectors that have their directions unchanged by a particular transformation; if we treat matrix as the transformation, we get vectors which are better suited to the space than the original coordinate system. I’m not going to write out eigenvalue/value decomposition: see here instead.
To plot the fruit preferences in two dimensions, we multiply the the first two eigenvectors with the sqrt of their values. (To plot in 3 dimensions, use the first three eigenvector-value pairs). This returns the 2D coordinates for our fruit preferences!
 Amy is the closest to everyone (according to the distance matrix), so she’s in the middle. The ones who married (/are marrying in)—Risa and I—are furthest away from members of the Smovell (Smith+Lovell) nuclear family. Makes sense!